
Web Analytics Report Template
Why Your Agency Needs a Web Analytics Report Template
Most digital marketing and social media marketing campaigns are designed to drive website traffic to your clients’ sites and sell more products or services, but many of today's web analytics tools add more complexity than clarity.
Make website data more accessible to your clients with dedicated web analytics report templates that clearly show what marketing activities your agency is doing to drive their success.
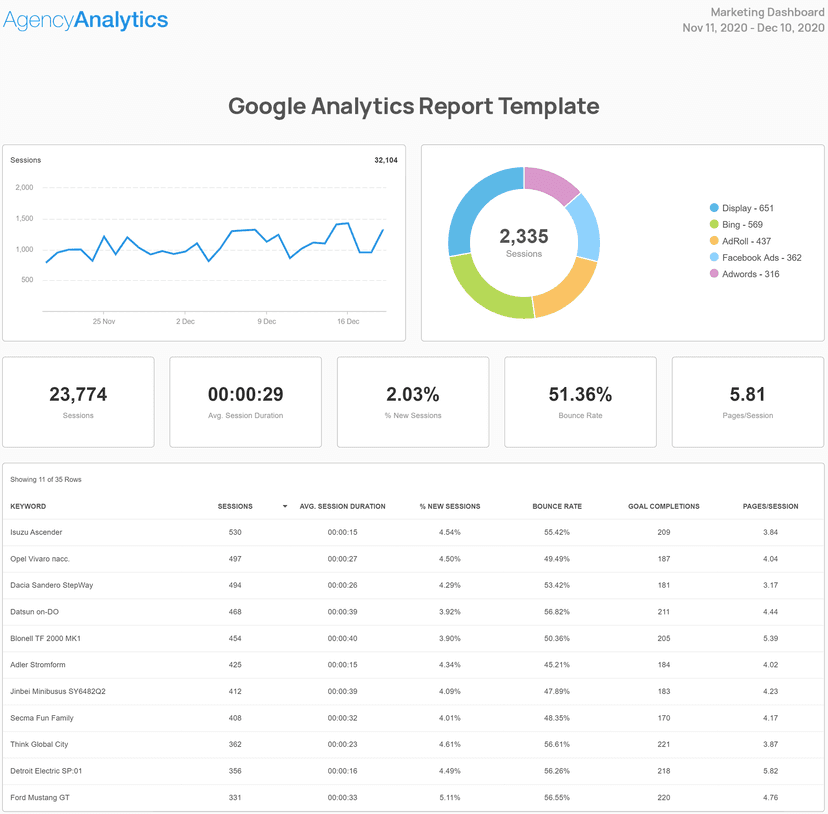
AgencyAnalytics automatically compiles metrics from different data sources so that agencies don’t have to spend hours to create a web analytics report manually on platforms like Google Analytics. Include all of the important information in your customized marketing report template, where you add your own analysis and discussion points for each client. Alternatively, use the web analytics dashboard to display the data in real time.
A web analytics report helps demonstrate how your agency is spending your client’s money and how you’re going to capitalize on your successes. It also helps formulate data-driven solutions for how to fix things that aren’t going well in the campaign and present those to your client in an easy and intuitive way.
Create Professional Web Analytics Reports in Minutes
Start Your Free Trial Today!8 Sections Included In the Web Analytics Report Template
A detailed and well-structured web analytics report is a time-saving necessity. The Web Analytics Report template is crafted to provide an in-depth view of your client's online performance by automatically pulling the most important data from Google's web analytics tool. This report is a strategic resource that significantly elevates the understanding of website visitors and their interactions with a website.
This web analytics report includes 8 crucial sections, each designed to offer valuable insights into different aspects of a client's web analytics. By integrating data from their Google Analytics account, this report template seamlessly brings together complex data in an easy-to-understand format. From tracking user journeys to scrutinizing the number of pages viewed, each section serves a unique purpose in painting a comprehensive picture of a larger marketing strategy. Let's get started.
1. Cover Page
Think of a Web Analytics Report as a detailed roadmap to website performance and user engagement. Use the Report Cover and Section Design Customization Feature to apply a background color or upload a custom image matching your agency's professional brand. Additional customization through title and image widgets allows for a cohesive branding approach throughout the report's content.

When a design truly aligns with your brand, save it. Doing so ensures a uniform brand presentation and simplifies the creation process for future reports.
The cover page is one page that serves a key function: it establishes the context for the high-quality analysis that follows. More than a visual entry point, it's a direct reflection of your agency's expertise. By setting the tone right at the beginning and then carrying it throughout your report, you subtly enhance your agency's credibility and nurture a positive client relationship.
2. Monthly Summary
The monthly write-up section gives you a free space to give clients your own personal analysis and summary of what’s happening on their website. Use this section of the report to maintain that relationship with your clients by discussing goals, deliverables, and results in plain English.

Talk about exactly what you did during a specific date range, perhaps the last month, to push you and your client’s goals forward. Clients appreciate real-world data and examples, which should be placed in this section. Use this space to present new strategies to your clients and iterations on existing strategies so they know just what you’re doing to maximize their ROI, save money, as well as trends that help show the bigger picture.
3. All Channels
Traffic comes to your client’s website from any number of channels, and this section displays all of the statistics related to these different traffic sources. You’ll see where traffic is coming in from each data source – search metrics, direct linking, referrals and social media – as well as key metrics like bounce rate and conversion rate.

This is a comprehensive section of the report that may get overwhelming for some clients, so make sure you give them a clear and succinct explanation of what they’re seeing here and how you’re acting upon these metrics. For example:
Metric | Importance | Example Use Case |
|---|---|---|
Metric Users | Importance Critical | Example Use Case Optimize marketing spend by identifying which channels drive the most traffic and conversions. |
Metric Bounce Rate | Importance High | Example Use Case Analyze channel-specific bounce rates to improve content alignment and user engagement. |
Metric Conversion Rate by Channel | Importance Critical | Example Use Case Allocate resources to enhance campaigns on channels that yield higher conversion rates. |
Metric Average Session Duration | Importance Useful | Example Use Case Use insights on time spent per channel to refine content strategies and user interaction. |
4. Devices
It’s important to know what devices potential customers are using to visit your client’s website. This section of the report displays a list of device names customers along with their average session duration, bounce rate and number of goal completions. It’s no secret that more and more customers are using mobile devices to browse the web, and you can see that directly in the Devices section of the report.

Use this section to show your clients exactly where potential customers browsing their site are coming from. This is valuable information you can use to push your clients to a more mobile-friendly configuration if they aren’t already.
Metric | Importance | Example Use Case |
|---|---|---|
Metric Device Type | Importance Critical | Example Use Case Optimize site design and functionality based on the predominant devices used by the audience. |
Metric Conversion Rate by Device | Importance Critical | Example Use Case Prioritize UX/UI improvements for devices that show lower conversion rates to enhance performance. |
Metric Session Duration by Device | Importance High | Example Use Case Tailor content and layout to improve engagement on devices where users spend more time. |
Metric Bounce Rate by Device | Importance High | Example Use Case Adjust mobile and desktop experiences to reduce bounce rates and enhance user retention. |
5. Location/Geographic
Reprot templates that include a Location/Geographic section gives you and your client a deeper look into the demographics of the people visiting your client’s web pages in a specific time frame. You’ll also be able to see specific conversion rates for each location, which can be insightful. Use this section to see how many people from different locations visit the site, how long they stay and how many of them convert in the end.

These metrics tell your client how you’re leveraging different geographic locations to drive more conversions and what you can do better in areas that aren’t performing well.
Here’s how these insights can be strategically employed:
Metric | Importance | Example Use Case |
|---|---|---|
Metric Geographic Location | Importance Critical | Example Use Case Customize marketing campaigns and content localization based on the preferences of specific regions. |
Metric Traffic Volume by Region | Importance Critical | Example Use Case Allocate advertising budgets and resources to regions that generate the most traffic. |
Metric Conversion Rate by Region | Importance High | Example Use Case Optimize and adjust offers or products to boost conversions in underperforming areas. |
Metric Engagement Rate by Region | Importance Useful | Example Use Case Refine content strategies to increase user engagement in regions with lower interaction rates. |
For example, if there are site visitors in a specific city that have a high bounce rate, maybe there is misleading content on their web pages regarding addresses or services. Explaining the user journey with geographic-specific insights helps guide new strategies.
6. Organic Search
This section of the web analytics report pulls data from a Google Analytics account. It shows the traffic and related metrics around organic search. You’ll also get to see which keywords perform the best in terms of conversions.

Use this section to drive your SEO strategy with your client. Incorporating top KPIs in custom web analytics reports is the best way to prove the value of your SEO services, by showing them the specific data points like direct conversions from organic traffic.
Metric | Importance | Example Use Case |
|---|---|---|
Metric Organic Search Traffic | Importance Critical | Example Use Case Analyze the volume of traffic from search engines to gauge SEO performance and adjust tactics. |
Metric Top Landing Pages | Importance High | Example Use Case Identify which SEO-optimized pages draw the most traffic, refining content to enhance user entry. |
Metric Search Engine Exit Rate | Importance Useful | Example Use Case Monitor exit rates by search engine to optimize pages where users are leaving too quickly. |
Metric Time on Page from Organic Search | Importance High | Example Use Case Use time on page data to evaluate content relevance and engagement for organic search visitors. |
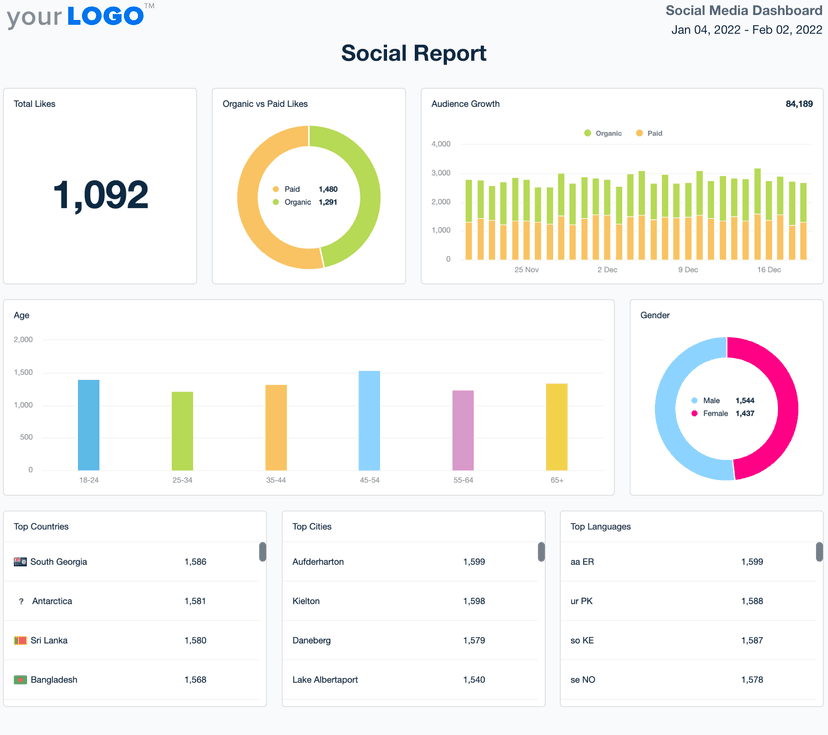
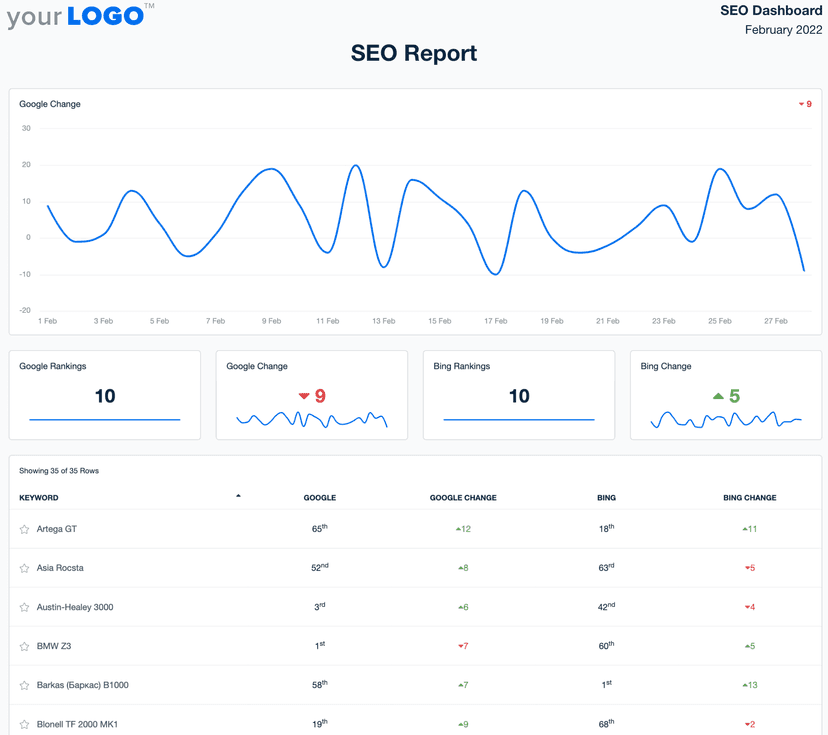
If you're specializing in SEO be sure to check out our SEO report template too!
7. Ecommerce
The ecommerce section of the web analytics report template displays all of the relevant key performance indicators for your client’s online shop. You’ll be able to tell which products are selling the best and what kind of revenue your client is earning from each product from the landing pages on their ecommerce site.

Use this section to start a discussion with your clients about focusing on specific products in new ad campaigns in the future.
Metric | Importance | Example Use Case |
|---|---|---|
Metric Average Order Value (AOV) | Importance Critical | Example Use Case Optimize pricing strategies and product bundling based on AOV trends to increase revenue per customer. |
Metric Cart Abandonment Rate | Importance Critical | Example Use Case Identify checkout flow issues and implement improvements to reduce cart abandonment. |
Metric New vs Returning Customers | Importance High | Example Use Case Tailor marketing strategies to either attract new customers or increase loyalty among returnees. |
Metric Product Page Engagement | Importance Useful | Example Use Case Refine product descriptions, images, and offers to enhance engagement and conversion on product pages. |
Then, build a marketing strategy to either capitalize on popularity or drive more customers to products that aren’t selling as well.
8. Paid Search
With paid search, you use pay-per-click (PPC) campaigns to display your ads on a client’s search engine results page (SERP) before any of the other results.

Again, like the other sections on this web analytics report template, the Paid Search (PPC) sections gives your clients a more in-depth look at the success or failure of your PPC campaigns.
You’ll be able to see how much traffic each campaign is driving and what kind of goal conversions are coming from them. Use a Google Analytics report template as an opportunity to make informed decisions and strategize with your clients, maximizing revenue and goal conversion rate.
Metric | Importance | Example Use Case |
|---|---|---|
Metric Engagement Rate | Importance High | Example Use Case Utilize engagement rate data to determine the effectiveness of ad content and landing page interaction. |
Metric Goal Completions | Importance Critical | Example Use Case Focus on the types of interactions that lead to goal completions, refining CTAs and user pathways. |
Metric Conversion Rate | Importance Critical | Example Use Case Analyze conversion rates to optimize ad spend and improve targeting accuracy for higher ROI. |
Metric Ecommerce Revenue | Importance Critical | Example Use Case Leverage revenue data to assess the direct financial impact of paid search campaigns, adjusting strategies to maximize profitability. |
Take their PPC reporting section one step further and include information on their paid Facebook Ads or email marketing initiatives. This helps you track leads different sources and paint a full picture of what is driving results and selling products most effectively.
The Takeaway
AgencyAnalytics is automatically collecting data that your clients care about in one, easy-to-understand report template. It pulls data from over 80 marketing channels like Google Analytics, Facebook, and more, giving your clients a full SEO report of their marketing key performance indicators. The time spent manually pulling clients' marketing data and updating spreadsheets is put toward analyzing data and driving more results.
Clients want to know about their website development, where their web traffic is coming from, and customer satisfaction. Website analytics tools, like Google Analytics, show exactly how their marketing campaigns are performing and provide actionable insights to make the necessary improvements resulting in more conversions.
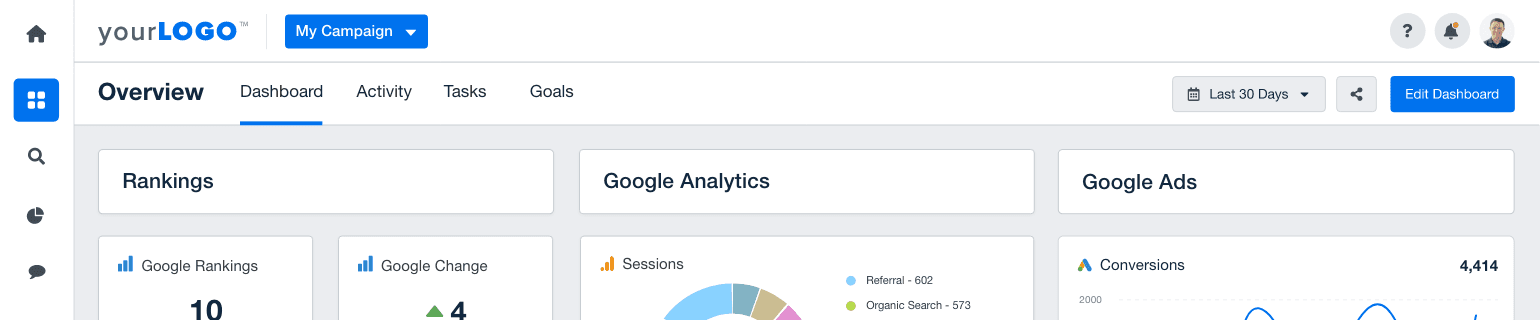
Need more sections or custom metrics? No problem, AgencyAnalytics lets you easily drag and drop new sections to your website analytics report.
Easily Report on All Your Client’s Web Analytics Data
Start Your Free 14-day TrialPowerful Web Analytics Reporting Software Built for Agencies
READY IN MINUTES
Win Back Billable Hours
Simplify your client reporting and get your reports out the door in minutes! With dozens of templates and a drag-and-drop report builder, create web analytics reports that highlight each client's unique KPIs.

SEO REPORTING TOOLS FOR AGENCIES
Add Rankings, Site Audits, and More
No Web Analytics report is complete without SEO. Track keyword rankings, include site audit data from Google Lighthouse, monitor backlinks, and more! A built-in suite of SEO tools and integrations helps you land new clients and improve your clients' performance in search engines.

A Fully Integrated Marketing Platform
With new integrations released each month, you have all your clients' real-time metrics under one roof. Access over 80+ marketing platforms by dragging and dropping widgets into place.
A comprehensive digital marketing report template consolidates all your client's marketing metrics into one centralized hub, driving efficiency, improving targeting, and maximizing conversions.
Who knew creating in-depth client reports could be so fun!

SHOWCASE YOUR AGENCY
Beautiful White Labeled Web Analytics Reports
Customize your entire platform and make reports that match your agency's brand colors. Upload your own logo and even host it on a custom domain! It'll look like it was built in-agency. We won't tell.

A powerful analytics tool that provides real-time data to our agency and our clients. I love the fact it adds a layer of transparency with our clientele as we are not just forwarding reports but providing a third-party solution with our branding.

Kevin Eberle
More Templates
Get Started for Free
Try AgencyAnalytics risk-free for 14 days. No credit card required.
Check out the Customizable Web Analytics Report Template